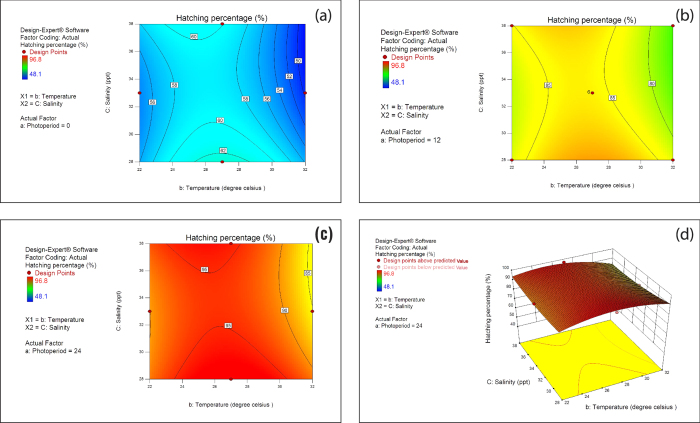
Figure 1.
Contour plot and Response surface plot of the hatching percentage (a) Contour plot of the hatching percentage obtained at 0 h photoperiod (b) Contour plot of the hatching percentage observed at 12 h photoperiod (c) Contour plot of the hatching percentage observed at 24 h photoperiod. Numbers shown in the square brackets are the hatching percentage at the corresponding contour (d) Response surface plot of hatching percentage (%): Effect of temperature and salinity at 24 h photoperiod. The bottom yellow plane represents the contour plot of the hatching percentage observed at 24 h photoperiod. Red dots in the axis show the levels of treatments used in the present study. Factors in capital letters indicate ETC factors.

