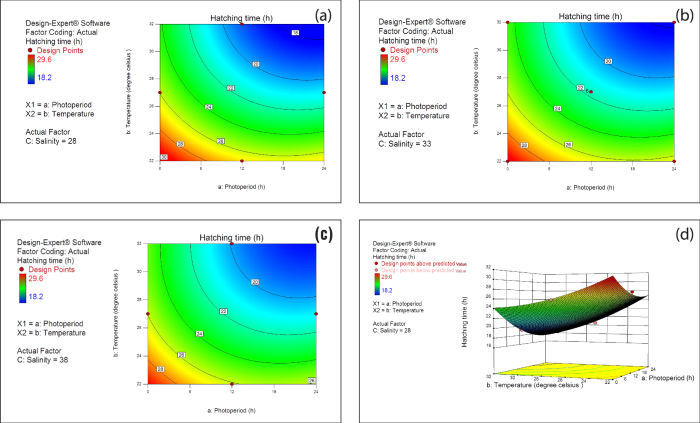
Figure 2.
Contour plot and Response surface plot of the hatching time (a) Contour plot of the hatching time observed at 28 ppt salinity (b) Contour plot of the hatching time observed at 33 ppt salinity (c) Contour plot of the hatching time observed at 38 ppt salinity. Numbers shown in the square brackets represents the hatching time at the corresponding contour. (d) Response surface plot of hatching time (h): Effect of temperature and photoperiod at 28 ppt salinity. The bottom yellow plane represents the contour plot of the hatching percentage observed at 28 ppt salinity. Red dots in the axis show the treatments level used in the present study. Factors in capital letters indicate ETC factor.

