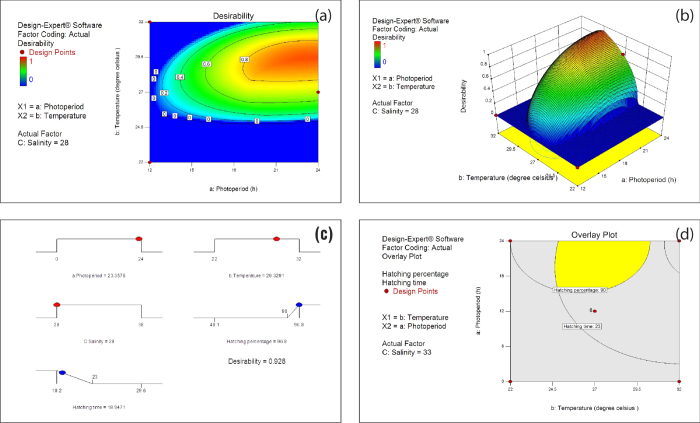
Figure 3.
Desirability function and overlay plot (a) contour plot of desirability function: Effect of photoperiod and temperature at 28 ppt salinity. (b) Response surface plot of desirability function: Effect of photoperiod and temperature at 28 ppt salinity he bottom yellow plane represents the contour plot of the hatching percentage observed at 28 ppt salinity Numbers shown in the square brackets represents the desirability function at the corresponding contour. Factors in capital letters indicate ETC factors. (c) Desirability ramp (graphical representation of numerical optimization results) for achieving optimum hatching output (maximum hatching percentage and minimum hatching time). The optimum value of photoperiod, temperature and salinity to achieve an overall desirability of 0.928 is depicted in desirability ramp. (d) Overlay plot showing recommended hatching operation region (yellow colour) for achieving desired hatching percentage and hatching time (here minimum 90% hatching percentage and maximum 23 h hatching time is set to ensure economical operation.

