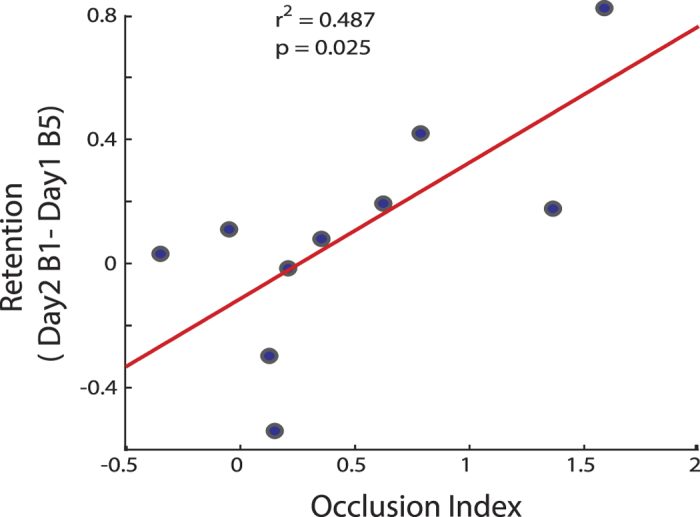
Figure 6. Correlation between Occlusion of LTP-like Plasticity and Behavior.

Y-axis represents the retention of the skill measure and x-axis represents the Occlusion Index. Blue circles represent individuals of the Long group. Note that subjects who had the largest OI after training had the best skill retention measured on day 2.
