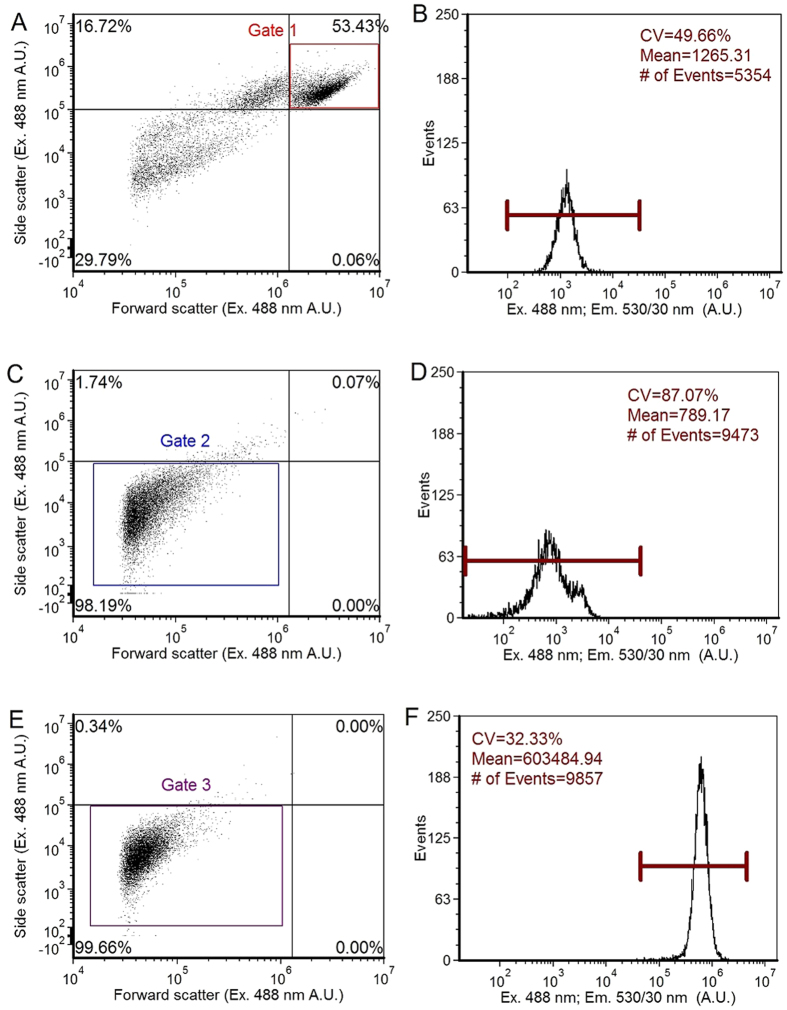
Figure 1. Flow cytometry results.
(A), (C) and (E) dot plots (n = 10000 cells) of side scatter versus forward scatter of RAW264.7 macrophage cells, E. coli and EGFP-E. coli, respectively. (B), (D) and (F) fluorescence intensity (green channel 530/30 nm) histograms of RAW264.7 cells within Gate 1 (red box) in (A), E. coli within Gate 2 (blue box) in (C) and EGFP-E. coli within Gate 3 (purple box) in (E), respectively. Low fluorescence intensities of RAW264.7 cells (mean = 1265.31; and CV = 49.66%) and E. coli (mean = 789.17; and CV = 87.07%) compared to EGFP-E. coli (mean = 603484.94; and CV = 32.33%) indicate that the cells with no EGFP are measuring autofluorescence.

