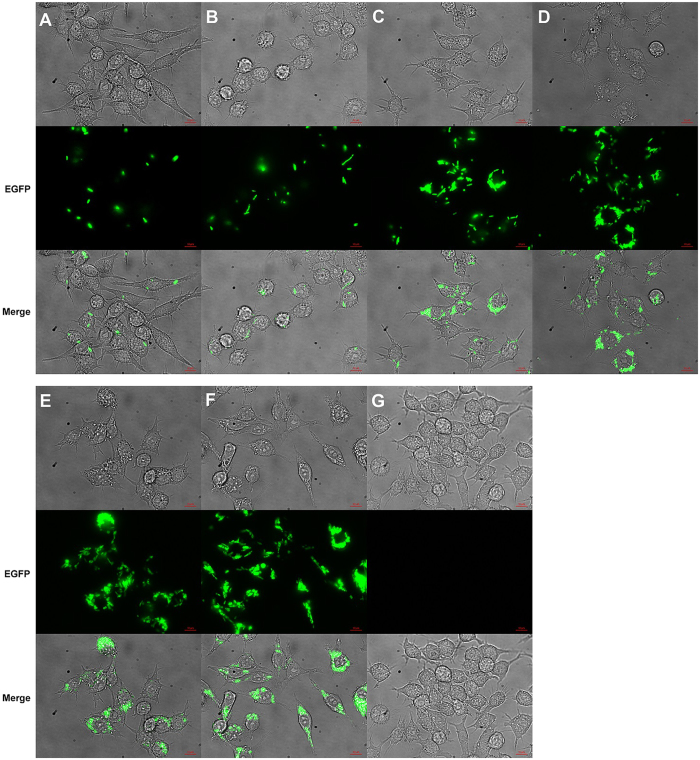
Figure 2. Fluorescence microscopy results.
(A–F) RAW264.7 cells images taken with bright field as well as fluorescence at 530-nm. The images panels (A through F) depict infection occurring by EGFP-E. coli at different time points: 5, 30, 60, 90, 120 or 180 min, respectively. Panel (G) provides bright field and fluorescence images of RAW264.7 cells not treated with the EGFP-expressing E. coli.

