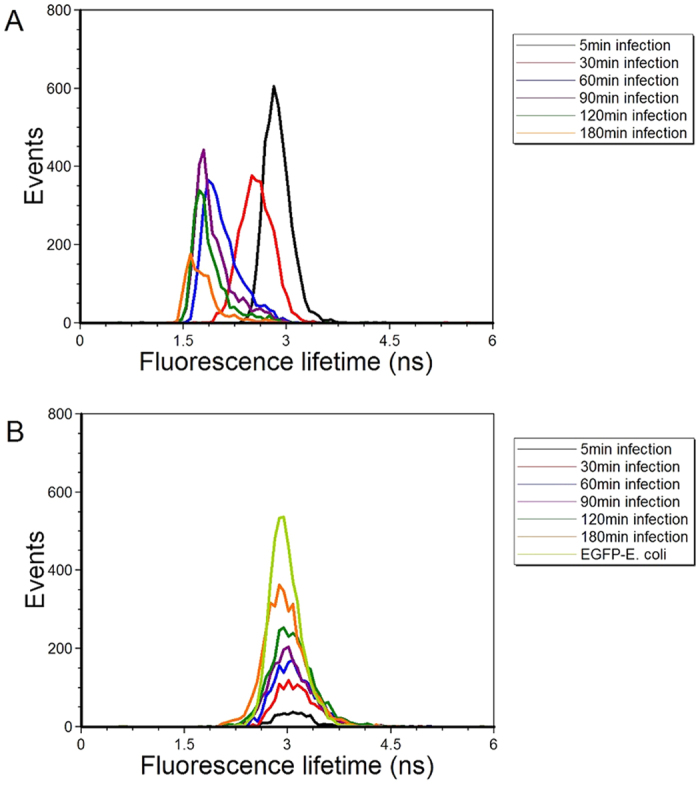
Figure 4. Measurements of the mean fluorescence lifetimes with a phase-sensitive flow cytometer.

In panels (A) are fluorescence lifetime histograms of the average fluorescence lifetime of EGFP when accumulated via E. coli into RAW264.7 cells at 5, 30, 60, 90, 120 and 180 min. Each histogram trace is color coded to indicate an increasing time point. Panel (B) provides the fluorescence lifetime histograms in which the fluorescence lifetime of EGFP was measured when expressed in E. coli when not in contact with the macrophage cells. For experimental control, the measurements were taken at the same time points as that for the infection treatments.
