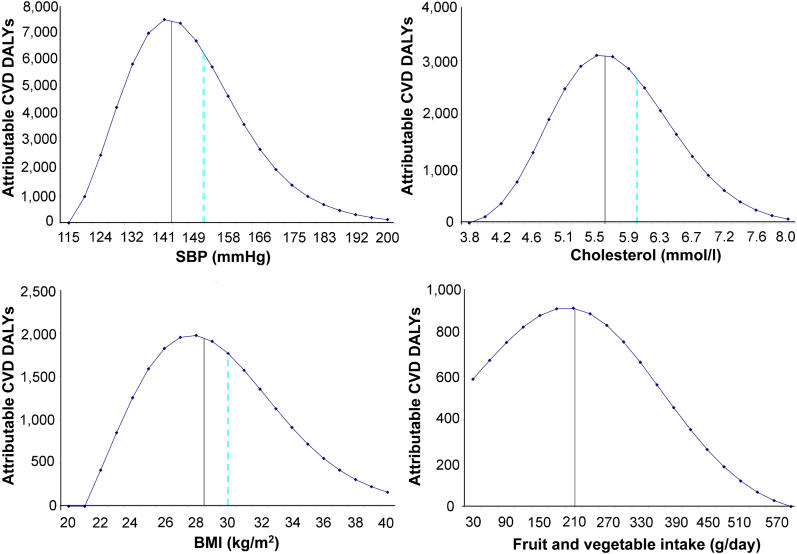
Figure 1. Distribution by Exposure Level of Attributable Disease Burden Due to Selected Continuous Risk Factors.
Figure 1 shows the distribution of the estimated cardiovascular disease (CVD) burden of disease (in DALYs) attributable to four major continuous risk factors, by exposure levels. Half the attributable burden occurs to the left of the solid vertical line and half occurs to the right. The dashed vertical lines indicate commonly used thresholds—150 mm Hg for hypertension, 6.0 mmol/l for hypercholesterolemia, and 30 kg/m2 for obesity. The blood pressure and cholesterol levels plotted are the estimated usual levels [22], which tend to have a smaller SD than levels based on one-off measurements commonly used in population surveys, because of normal day-to-day and week-to-week fluctuations. For example, the distribution of usual blood pressure is about half as wide as the distribution of one-off blood pressure measures, and so many fewer people would be classified as hypertensive (or hypotensive) if classifications were based on usual rather than one-off blood pressure. Thus, if a population mean SBP was 134 mm Hg, the SD of once-only measures might be 17 mm Hg (with about 18% of the population having one-off SBP over 150 mm Hg), and the SD of usual SBP based on many measures would be about 9 mm Hg (hence about 5% of the population would have usual SBP over 150 mm Hg).

