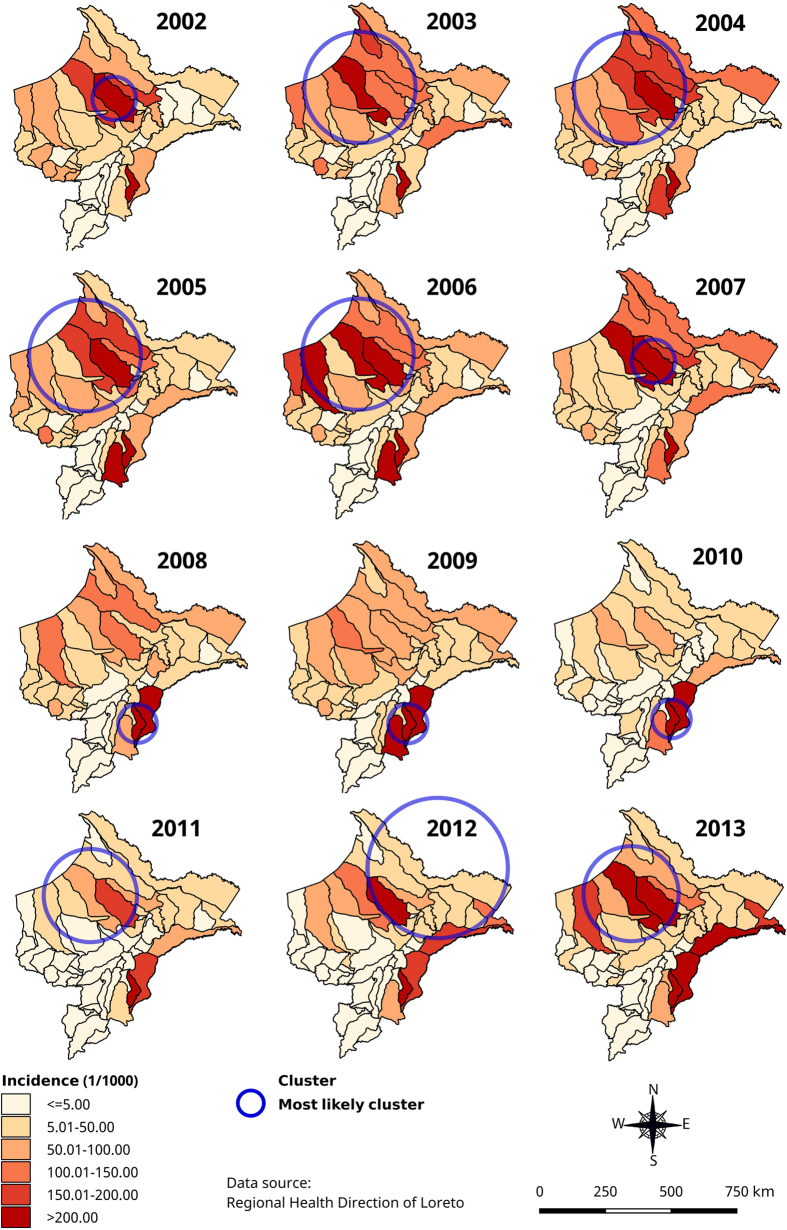
Figure 4. Annual P. vivax incidence and adjusted significant most likely spatial clusters at district level in Loreto Region: 2002–2013 (using Satscan purely spatial analysis).
Map generated with QGIS 2.16 (QGIS Development Team, 2016. QGIS Geographic Information System. Open Source Geospatial Foundation Project. http://www.qgis.org/).

