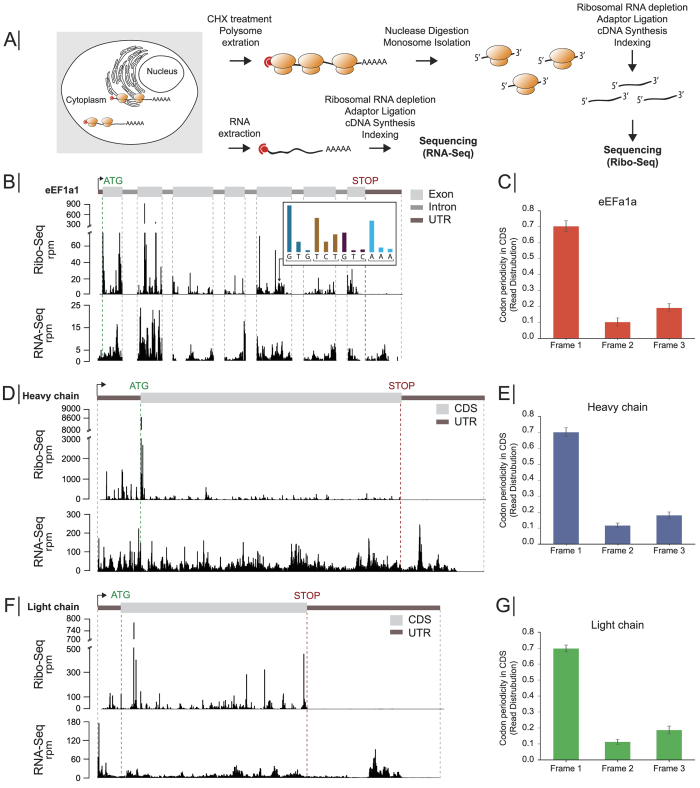
Figure 2. Ribosome profiling of CHO cells.
(A) Schematic representation of ribosome profiling workflow in which Ribo-Seq and RNA-Seq data were simultaneously generated. (B) Read depth along the genes from Ribo-Seq (top track) and RNA-Seq (bottom track) of eEF1a1 on day 3. Insert depicts the read distribution along ORF. Brackets indicate translated ORF codon. (C,E,G) Codon periodicity seen from Ribo-Seq data in the open reading frame of eEF1a1, heavy chain, and light chain. Ribo-Seq and RNA-Seq read distribution on day 3 are shown for the (D) heavy chain, and (F) light chain. RPM: transcripts per million, CDS: coding sequences.

