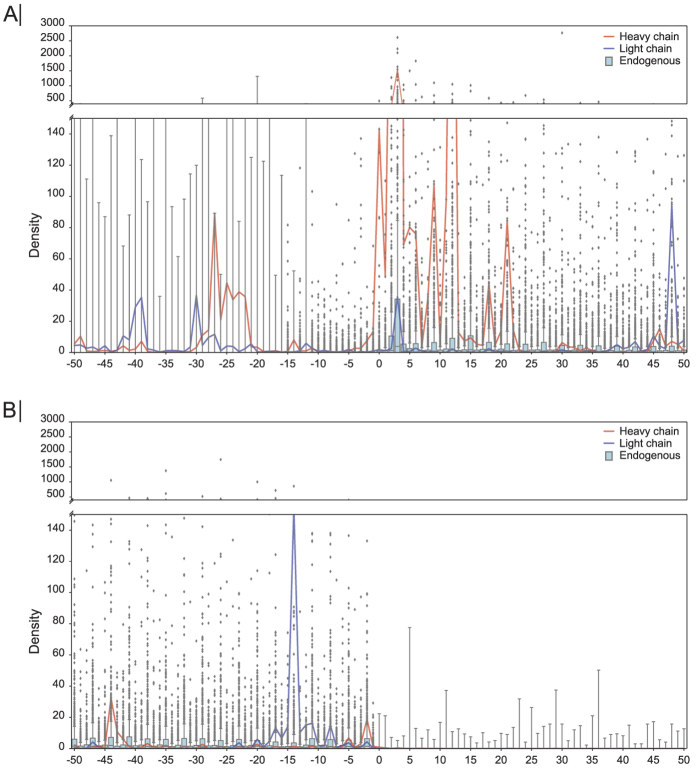
Figure 3. Ribosomal densities around translation start- and stop sites on day three.
(A) Ribosomal densities around the translational start site. Red- and blue lines represent the heavy- and light chain mRNA, respectively. The boxplot at each position represents the normalized ribosomal density of all endogenous mRNAs. (B) Normalized ribosomal densities around the translational stop site. Ribosomal densities for each mRNA were normalized by the median density of the given mRNA.

