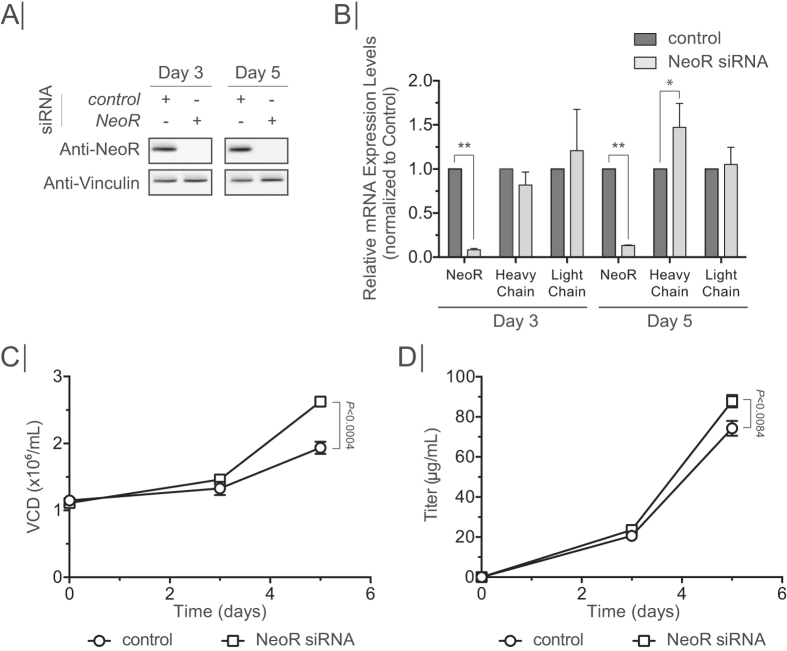
Figure 7. Knock-down of NeoR.
(A) Western blot showing knock-down efficiency on protein level in cell treated with either Control siRNA or NeoR siRNA from day 3 and day 5 post transfection. Vinculin presented as loading control. (B) RT-qPCR showing knock-down efficiency on mRNA level. Values were normalized to control siRNA. *P < 0.04, **P < 0.0001. (C) Viable cell density of cultures treated with control or NeoR siRNA. (D) Antibody productivity of cultures treated with control or NeoR siRNA. Error bars depict standard deviation (n = 3). P-values were determined by Student’s t-test (two tailed).

