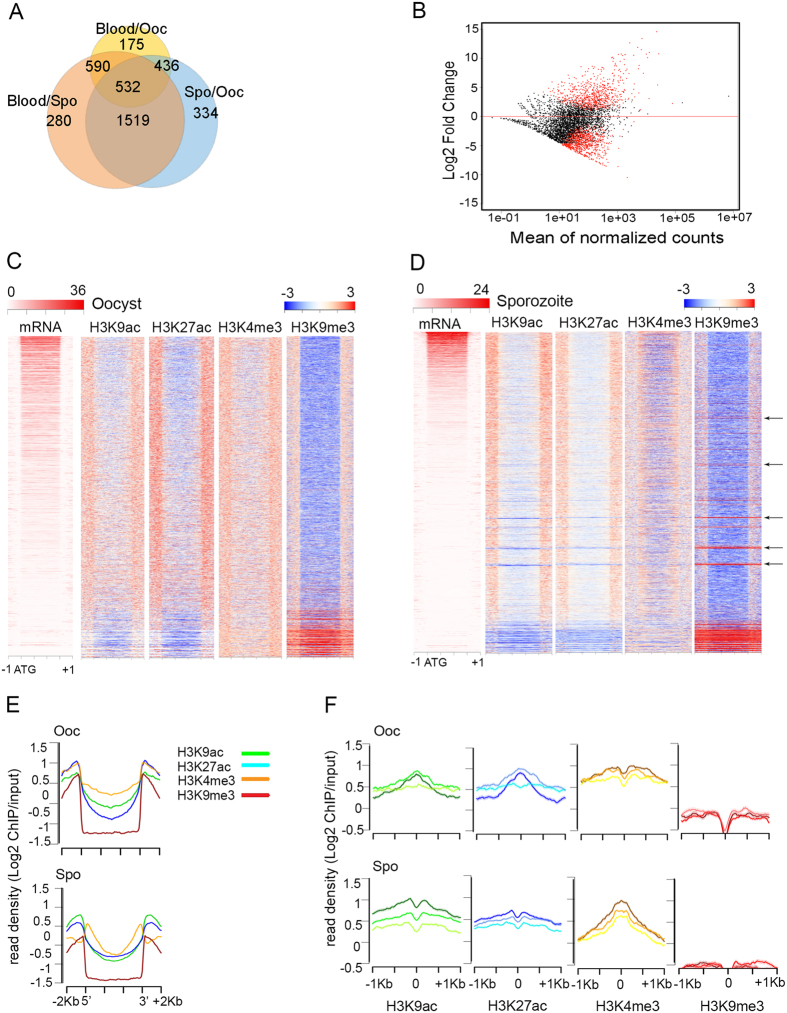
Figure 1. Correlation between gene expression and histone post-translational modifications during P. falciparum development in the mosquito.
(A) Venn diagram showing the overlap among differentially expressed genes in various stages of the P. falciparum life cycle (including blood, oocyst and sporozoite stages). (B) MA plot where M (y-axis) is the binary logarithm of the intensity ratio and A (x-axis) is the average log intensity for a dot in the plot for differentially expressed genes between oocyst and sporozoite stages in the mosquito. Red dots indicate genes for which differences are significant for a p-value cutoff of 0.05. (C) Histone modification profiles in oocysts. Heatmaps correspond to ChIP-seq signal of H3K9ac, H3K27ac, H3K4me3, and H3K9me3 in oocysts ordered by RNA levels at this stage. The region comprises 1 kb upstream and downstream of the translation start and termination codons, respectively. (D) Histone modification profiles in sporozoites. Heatmaps correspond to ChIP-seq signal of H3K9ac, H3K27ac, H3K4me3, and H3K9me3 in sporozoites ordered by RNA levels at this stage. The region comprises 1 kb upstream and downstream of the translation start and termination codons, respectively. (E) Normalized/input corrected sequence reads (reads per million of reads mapped, RPKM) for each histone modification were plotted along P. falciparum genes comprising gene bodies and 2 kb upstream and downstream of the translation start (ATG) and termination codons, respectively. (F) Profile plots showing changes in levels of H3K9ac, H3K27ac, H3K4me3, and H3K9me3 in P. falciparum oocysts (top) and sporozoites (bottom). Genes were divided into three groups and ranked by their mRNA levels. The graphs represent normalized/input corrected ChIP-seq read unique counts (RPKM) mapped with respect to the ATG protein initiation codon for each of the three classes of genes based on RNA levels. For each graph, the darkest color represents the highest RNA levels and the lightest color represent the genes with lowest transcription.

