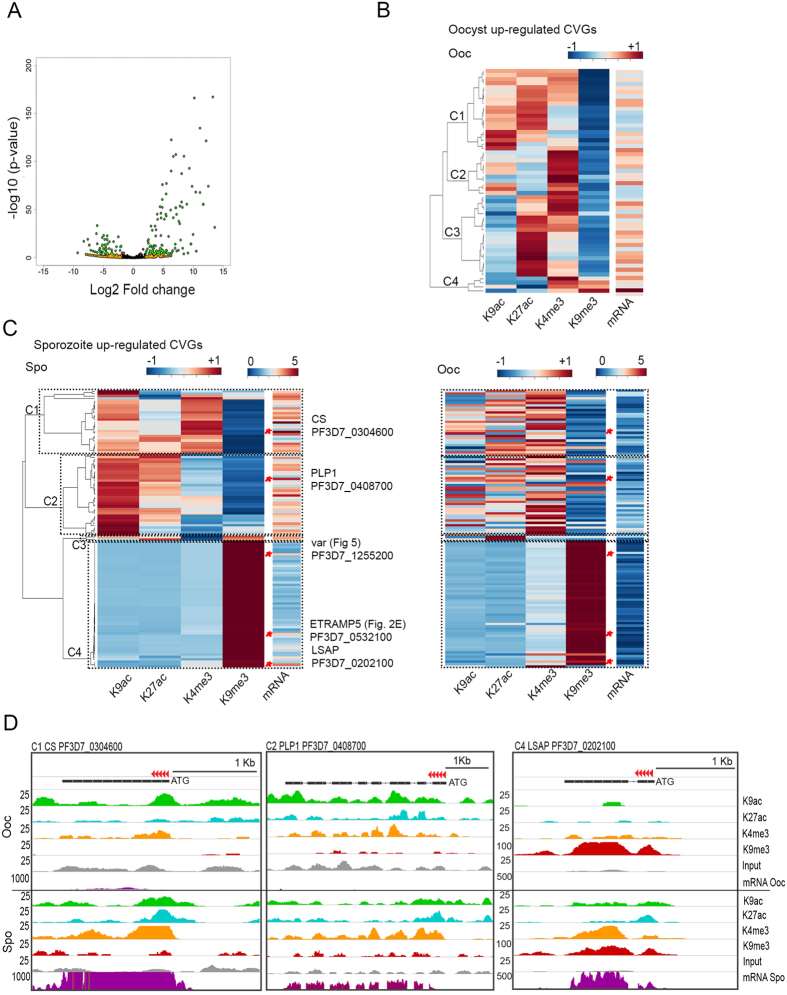
Figure 3. Histone modifications and transcription in developmentally regulated clonally variant genes.
(A) Volcano plot of clonally variant gene families showing differential gene expression during the oocyst-sporozoite stage transition. Points are colored according to the magnitude of change and statistical significance (Orange: Log2 Fold Change >2 or <−2; Red: P < 0.001; Green: Log2 Fold Change >2 or <−2 and P < 0.001; and Black: none of the above). (B) Dendogram showing levels of enrichment in active and repressive histone modifications (H3K9ac, H3K27ac, H3K4me3 and H3K9me3) and RNA levels for CVGs expressed in oocysts but not in sporozoites (oocyst-specific CVGs). Only those genes with FDR-corrected P-value < 0.001 and >2.0 fold change are considered. Enrichment are log10 transformed values. The region considered to calculate the average enrichment comprises gene bodies and 1 kb upstream of the translation start codon. (C) Dendogram showing levels of enrichment in active and repressive histone modifications (H3K9ac, H3K27ac, H3K4me3 and H3K9me3) and RNA levels for sporozoite-specific CVGs (left panel). Only those genes with FDR-corrected P-value < 0.001 and >2.0 fold change are considered. Enrichment are log10 transformed values. The region considered to calculate the average enrichment comprises gene bodies and 1 kb upstream of the translation start codon. The right panel shows chromatin states and RNA log2 fold change expression values in the oocyst stage for the set of sporozoite-specific CVGs, sorted by the same gene order as in the dendogram on the left. The comparison shows changes associated with the activation of these genes prior to transmission (not shown in panel C). Asterisks point to examples of genes in panel D. (D) Examples of CVGs showing various combinations of histone modifications. Genes representative of each cluster found in panel C are highlighted. Tracks for H3K9ac (green), H3K27ac (blue), H3K4me3 (yellow) and H3K9me3 (red) correspond to the same number of reads between the two parasite stages. Red arrows indicate direction of transcription.

