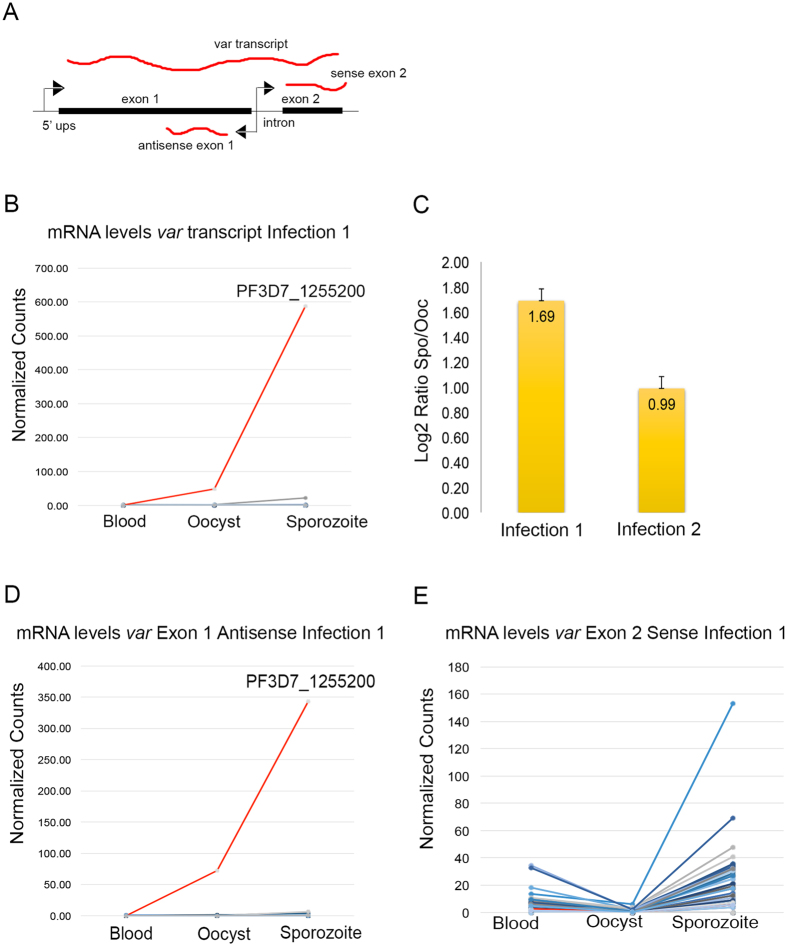
Figure 5. Gene expression patterns of var genes in the blood of human donors and during the sporogonic development of P. falciparum after infection.
(A) Schematic map of a typical var locus showing the different types of RNAs transcribed from the 5′ upstream region and the intron. (B) Changes in the expression of the full-length sense transcript for all var genes during the blood, oocyst and sporozoite stages. The figure shows the results of the infection for donor #1, which had only gametocytes present in the blood. Only the RNA corresponding to the active PF3D7_1255200 var gene is visible (red), since the rest of the var genes express no or very low levels of this transcript. (C) Results of the qRT-PCR assay for the active PF3D7_1255200 var gene using primers targeting a region in exon 1. The results suggest upregulation of this var gene during the oocyst to the sporozoite transition in two different experimental infections. (D) Expression of exon 1 antisense lncRNAs for all var genes in the blood, oocyst and sporozoite stages during infection #1. Only the transcript corresponding to the PF3D7_1255200 var gene is visible (red). (E) Expression of exon 2 sense RNAs for all var genes in the blood, oocyst and sporozoite stages during infection #1. In this case, all var genes express this transcript, which is thought to be involved in var gene silencing. Levels of this RNA corresponding to the PF3D7_1255200 var gene (red) are low.

