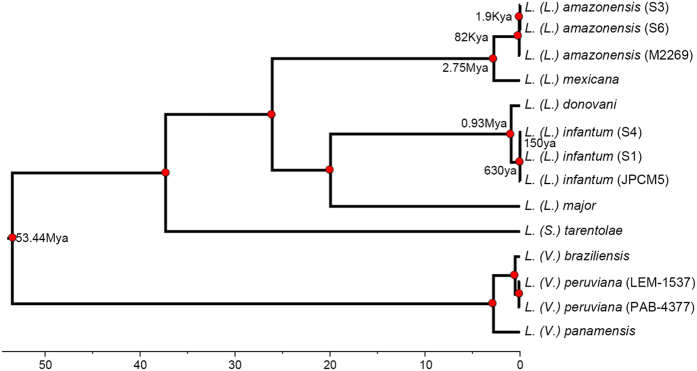
Figure 2. Bayesian based divergence time analysis under the relaxed clock model.
Concatenated dataset 294 loci (302,742 nucleotides). The x-axis shows absolute time scale in millions of years and nodes are located at the mean divergence. This result shows that isolates S3 and S6 correspond to L. (L.) amazonensis and have an 82Ky divergence from the M2269 L. (L.) amazonensis strain. All nodes in the tree are supported with a posterior probability of one (red circles on figure).

