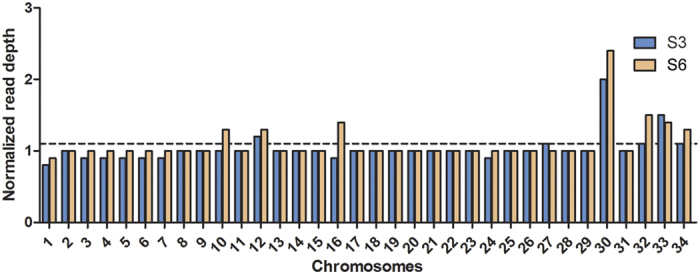
Figure 3. Chromosome copy number variation in L. (L.) amazonensis isolates S3 and S6.

Columns represent the estimated haploid copy number for each chromosome. Mean genome ploidy is indicated by a dotted black line.

Columns represent the estimated haploid copy number for each chromosome. Mean genome ploidy is indicated by a dotted black line.