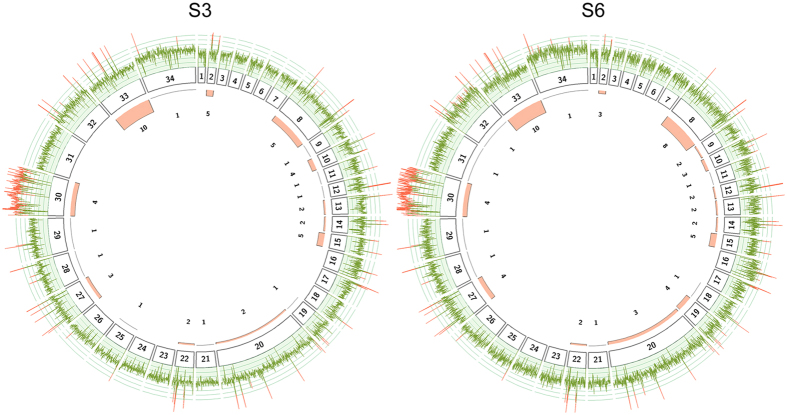
Figure 4. Chromosome and gene copy number variations in L. (L.) amazonensis isolates.
The figure shows the read depth coverage on each individual chromosome (internal boxes) along with the number of expanded genes for each isolate. The mean read depth is shown as a line plot for each chromosome in green for disomic regions and on red for expanded genomic regions. For instance, read depth is evenly distributed along the entire chromosome 30 on both isolates suggesting that the whole chromosome is expanded. The internal histogram displays the total number of gene expansions identified in each chromosome indicating that most expanded genes are located on chromosome 33.

