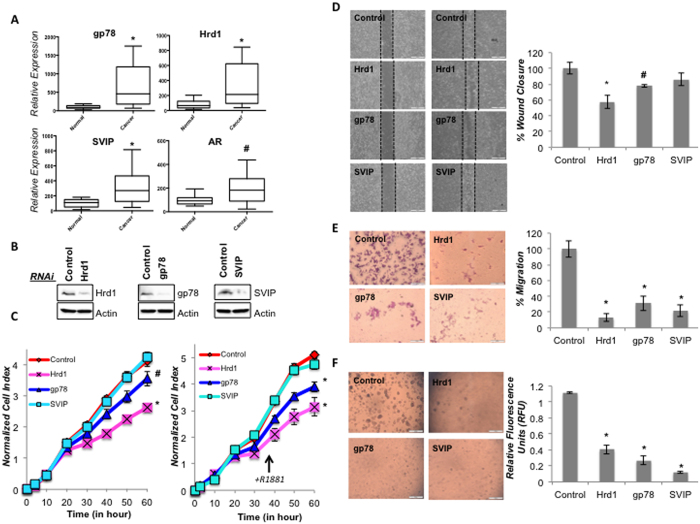
Figure 6. The role of gp78, Hrd1 and SVIP in prostate cancer tumorigenesis.
(A) Relative expression of some ERAD genes and AR in prostate cancer tissues (n = 39) compared to normal prostate tissue (n = 9) detected by RT-qPCR. Experiment was performed in 3 technical replicates. B-actin gene is used as reference gene. p-values were calculated with respect to vehicle-treated cells by two-tailed equal variance Student’s t-test (*p < 0.005, #p < 0.05). (B) LNCaP cells were transfected with siRNA for the indicated genes. Silencing the expression of indicated proteins were analyzed with immunoblotting as in Fig. 2. (C) The proliferation rates of cells silenced as indicated were determined with real time cell growth assay of three biological and six technical replicates. Cells were treated with vehicle and R1881 in left and right, respectively. (D) Wound healing assay was performed using LNCaP cells seeded on 35 mm dishes with high culture-insert coating (IBIDI). The closure of the gap created by the removal of insert was monitored for three days. Representative images are shown. The analysis of wound closure% was determined using the ImageJ software. Two independent biological and three technical repeats per experiment were used. p-values were calculated with respect to control siRNA transfected cells by two-tailed equal variance Student’s t-test (*p < 0.005, #p < 0.05). (E) Boyden chamber assay was done using 24-well transwell chamber as explained in the Material and Methods section. The migrated LNCaP cells on the lower surface of the membrane were fixed and stained with Giemsa. Representative images are shown. Migration was quantified by counting stained cells. The mean percentage of migrated cells compared to control groups were given using the data obtained from two independent biological replicates in triplicates (*p < 0.005). (F) The colonogenic assay of LNCaP cells was performed as explained in Material and Methods. Representative microimages are shown. Quantification of colony formation of cells was performed with CyQuant GR dye using a fluorometer (*p < 0.005).

