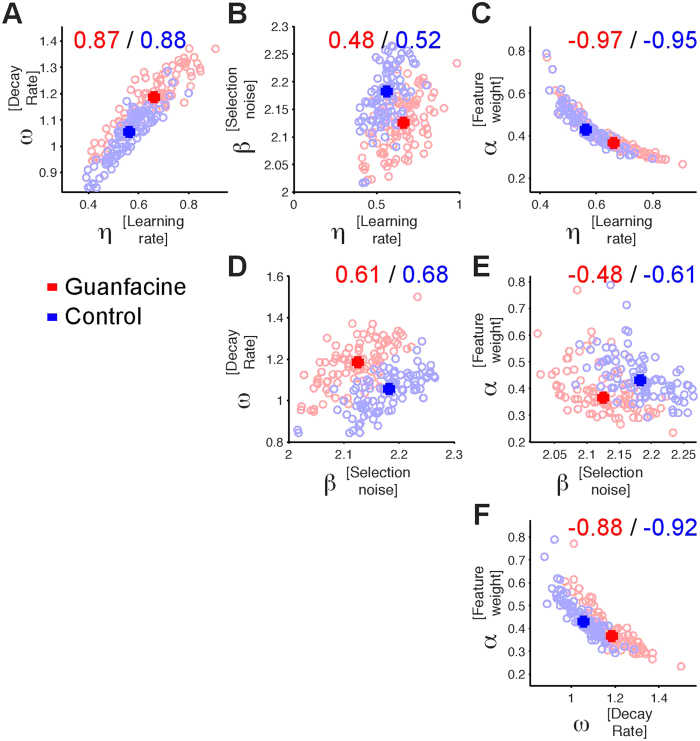
Figure 7. Relation of model parameters underlying reversal performance.
(A–C) Changes in learning rate (x-axis) across n = 100 cross validation training models are positively correlated with value decay (A) and beta selection noise (B), and negatively correlated with feature weighting (C). Red and blue numbers denote the correlation coefficient for Guanfacine (red) and control (blue) data points. (D–F) Same format as (A–C) but showing scatterplots of the correlation between beta selection noise, decay rate and feature weighting.

