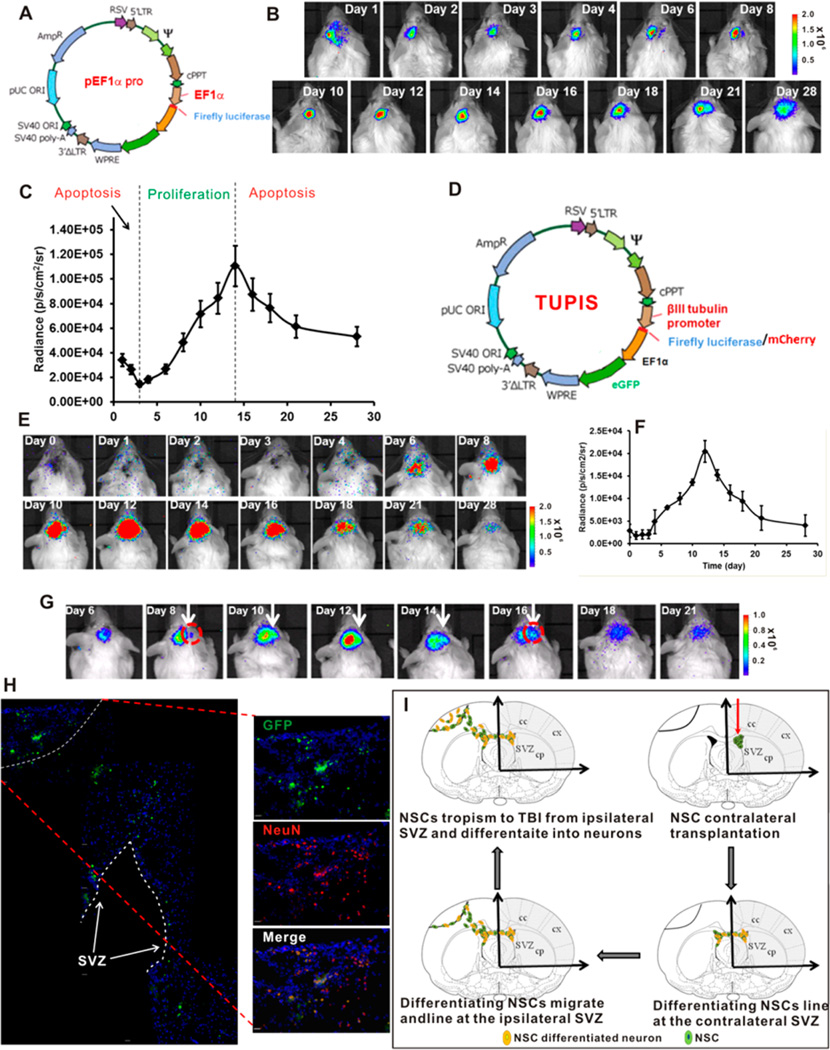
Figure 4.
Spatiotemporal imaging of the dynamics NE-4C NSC differentiation. (A) Map of vector used for tracking the migration, proliferation and apoptosis patterns of contralaterally transplanted NSCs in TBI mice. (B) BLI results of contralaterally transplanted NSCs in TBI mice over 28 days. (C) Analysis of differentiation stages (proliferation and apoptosis) of contralaterally transplanted NSCs in TBI mice. (D) Map of bicistronic vector with tubb3 promoter driven reporter gene and independent EF1α driven GFP. Drawing is not in scale. (E) BLI of the dynamic differentiation of NE-4C NSCs stimulated by 100 nM RA-loaded nanovehicle over 28 days. (F) Analysis of the differentiation pattern of BLI results. (G) BLI of the TBI tropism pattern of differentiating NSCs stimulated by 100 nM RA-loaded nanovehicle. (H) Montage of immunofluorescence staining of brain sections illustrating the migration pattern of differentiating NSCs at day 21. Scale bar = 50 µm. (I) Proposed NSC migration, proliferation, apoptosis and differentiation patterns of 100 nM RA-loaded nanovehicle stimulated NSCs in TBI mice. Drawing is not in scale.

