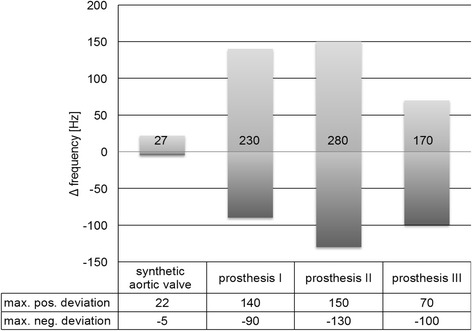
Fig. 4.

Quantitative aberration from B0 magnetic field in all investigated objects. Deviation in Hertz (Hz) derived from B0 maps and profile plots. Corresponding table showing positive and negative maximum of field aberration in Hz over the whole investigated distance. The numbers within the bars indicate the absolute range of deviation in Hz, as it is used for the quantitative score
