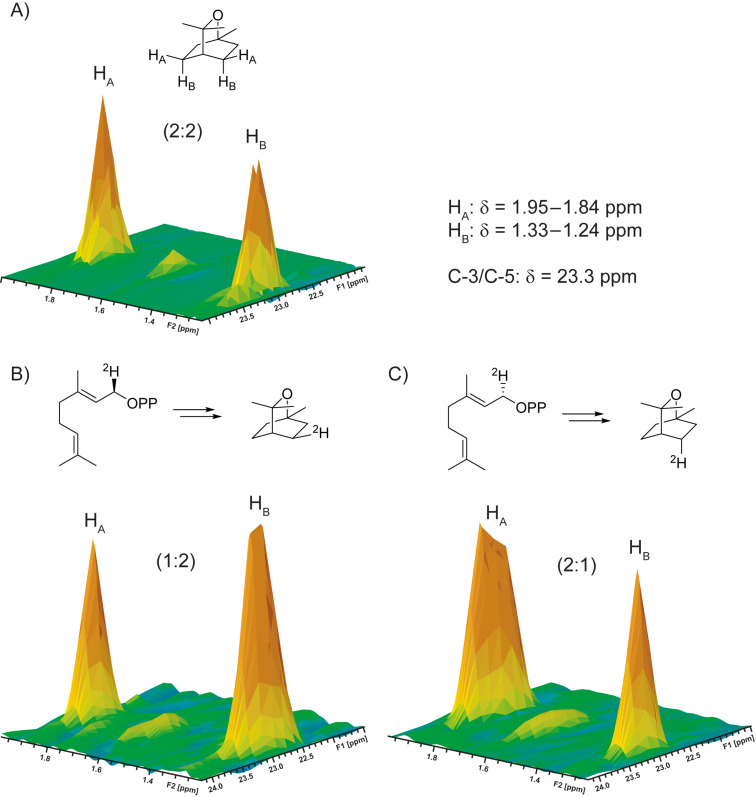
Figure 2.
Partial HSQC spectra showing the region of crosspeaks for HA and HB connected to C-3 and C-5 of A) unlabelled 1, B) (2H)-1 obtained by enzymatic conversion of (R)-(1-2H)GPP, and C) (2H)-1 obtained by enzymatic conversion of (S)-(1-2H)GPP. The indicated chemical shift data are for unlabelled 1 (for full data cf. Table S1, Supporting Information File 1).

