
Figure 2.
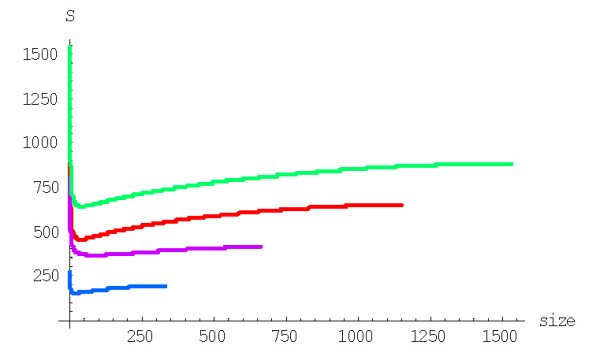
Coefficient of variation of the extinction time versus the family size for the linear BDIM. The model parameters are for D. melanogaster (blue), C. elegans (purple), H. sapiens (red), A. thaliana (green) (Table 1 in [43]).
Official websites use .gov
A
.gov website belongs to an official
government organization in the United States.
Secure .gov websites use HTTPS
A lock (
) or https:// means you've safely
connected to the .gov website. Share sensitive
information only on official, secure websites.
Coefficient of variation of the extinction time versus the family size for the linear BDIM. The model parameters are for D. melanogaster (blue), C. elegans (purple), H. sapiens (red), A. thaliana (green) (Table 1 in [43]).