
Figure 21.
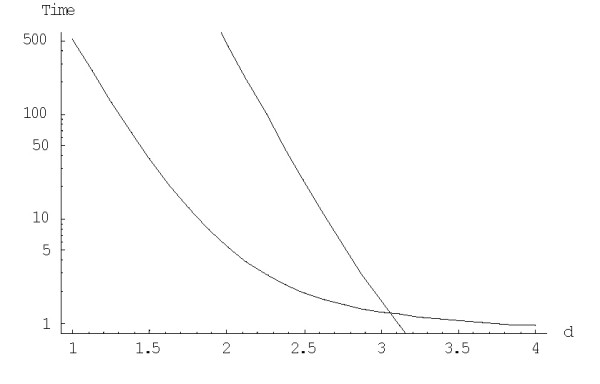
Mean times (in 1/λ units) of formation (upper curve before the point of intersection) and extinction (upper curve after the point of intersection) of the largest family depending on the model degree (semi-logarithmic scale). The model parameters are for Homo sapiens.