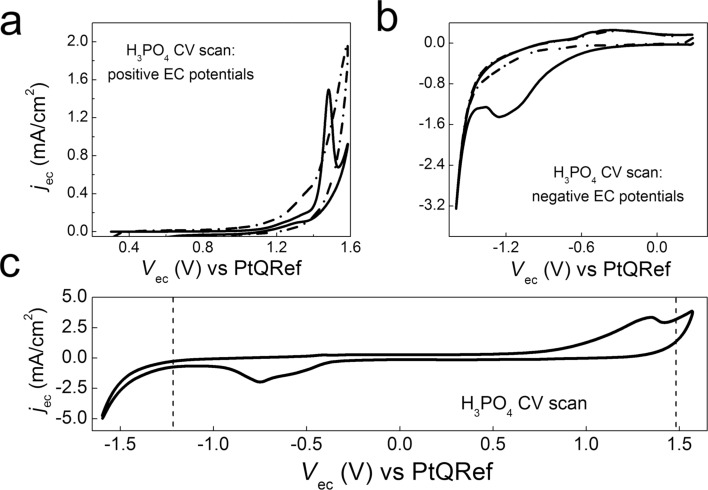
Figure 1.
CV in H3PO4 at different EC potential ranges (scan rate = 150 mV/s). a) First (continuous line) and second (dash-dotted line) scan from 0.3 V to 1.6 V. b) First (continuous line) and second (dash-dotted line) scan from 0.3 V to −1.6 V. c) extended CV from −1.6 V to 1.6 V; the dashed lines mark the original position of the anodic and cathodic peaks.

