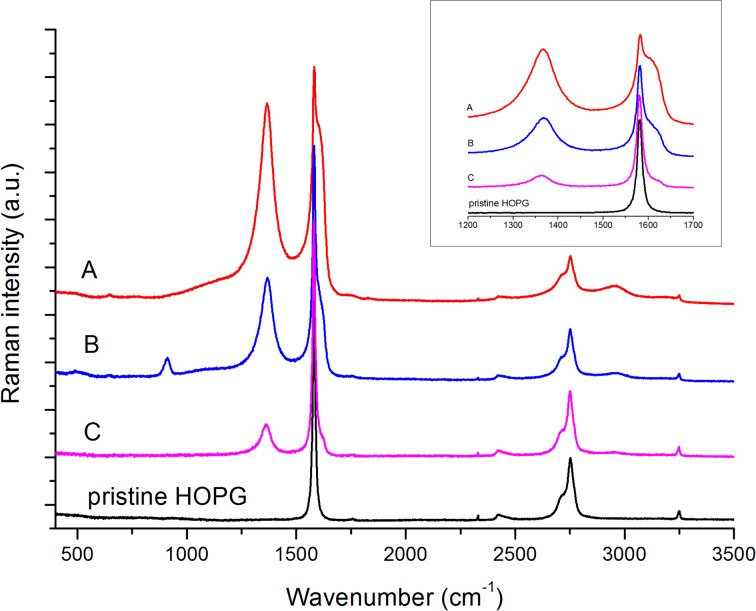
Figure 5.
Raman spectra (excitation wavelength of 457.9 nm) of the HOPG sample subjected to 15 CV cycles in the range from +0.3 V to +1.6 V (see Figure 1a). From the top: spectrum of region A (red line); region B (blue line); region C (magenta line). The Raman spectrum drawn with the black line has been taken from a region of the sample not affected by the EC process and it can be considered as a representative reference spectrum of the pristine material (HOPG).

