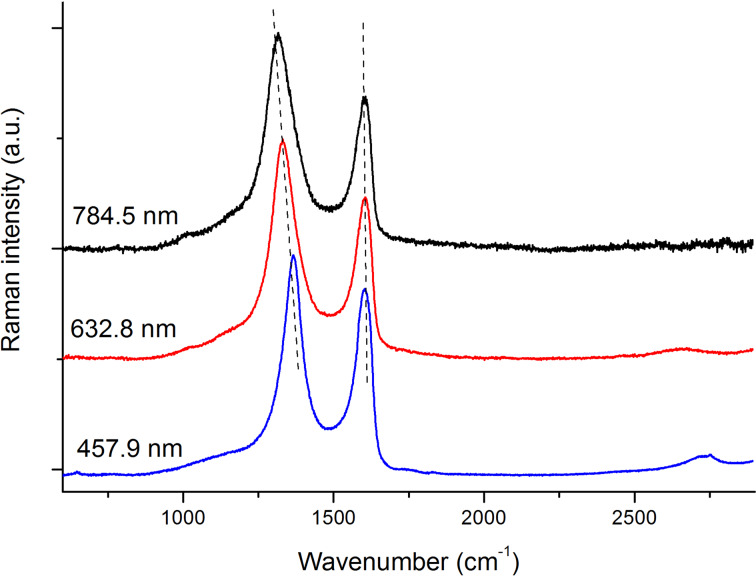
Figure 7.
Spectral subtraction of the spectrum of the pristine graphite from the Raman spectra of the A region. From top to bottom: Raman excitation at 784.5 nm (black line), 632.8 nm (red line) and 457.9 nm (blue line). The D peak shows a dispersion of 44 cm−1/eV, similar to that observed in microcrystalline graphite [19,22].

