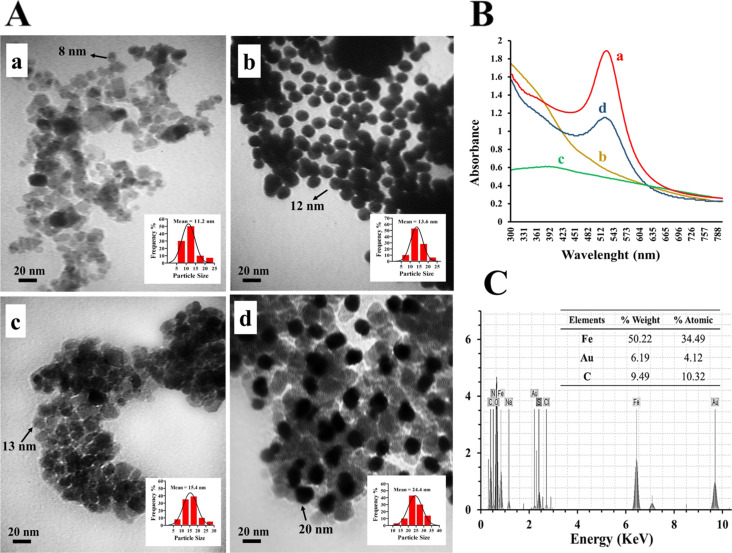
Figure 2.
(A) TEM images of synthesized Fe3O4 NPs (a), gold NPs (b), TMC@Fe3O4 NPs (c), and gold–magnetic NPs (d) with their corresponding particle size distribution (inset). (B) UV–vis analysis of gold NPs (a), Fe3O4 NPs (b), TMC@Fe3O4 NPs (c), and gold–magnetic NPs (d). (C) EDXD spectra of gold–magnetic NPs.

