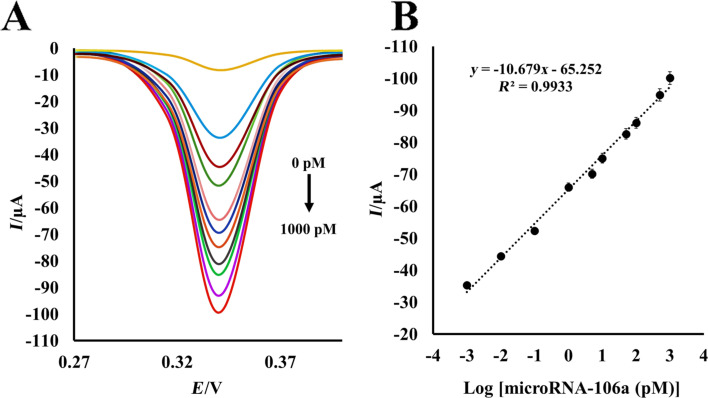
Figure 4.
(A) Differential pulse voltammograms for the electrochemical detection of miR-106a upon serial dilutions of target miR-106a at scan rate 100 mV/s in 1 M HCl. The concentrations of target miRNA are: 0, 0.001, 0.01, 0.1, 1, 5, 10, 50, 100, 500, and 1000 pM. (B) The calibration curve of miR-106a as the relationship between current and logarithm of miR-106a concentration. Each data point is the average of five replicates.

