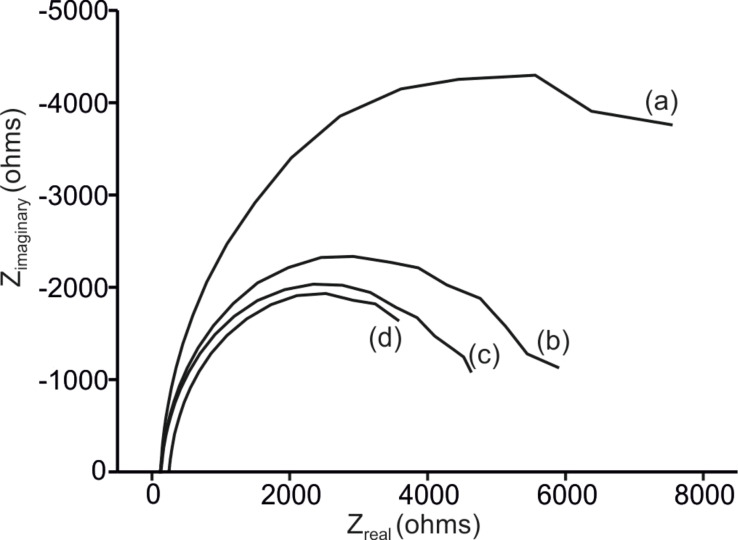
Figure 3.
Nyquist plots collected at −0.5 V using (a) PEDOT/PSS; (b) PEDOT/PSS/CuPc; (c) PEDOT/PSS/LuPc2; and (d) PEDOT/PSS/AuNP. Electrodes were immersed in catechol 10−3 mol·L−1 with 0.01 mol·L−1 phosphate buffer (pH 7.0) as the supporting electrolyte. The frequency was swept logarithmically from 10−2 to 105 Hz.

