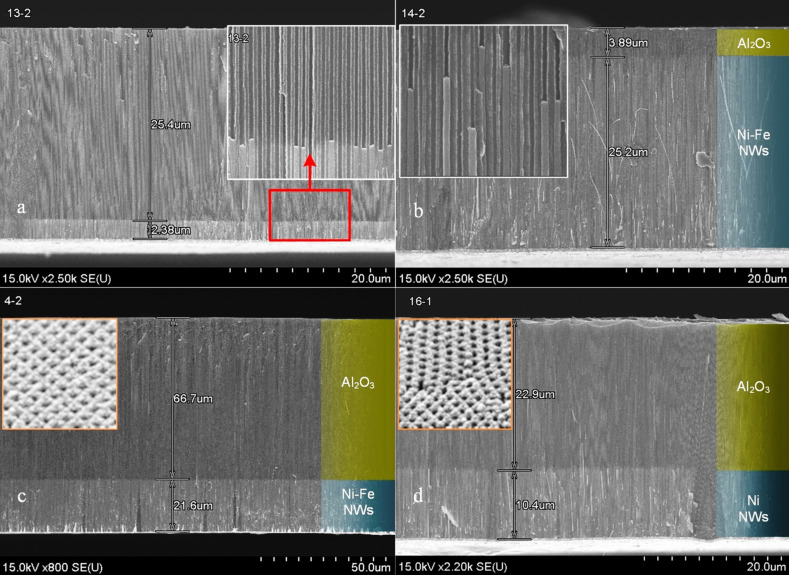
Figure 3.
SEM cross-sectional views of the alumina template after galvanostatic dc deposition of Ni–Fe (a, b, c) and Ni (d) NW arrays under the following conditions: current density 3 mA·cm−2, deposition duration 10 min (a, d), 90 min (b) and 150 min (c). In the insets: the top-view SEM images of the template (red frame) and the enlarged image of the deposition front depending on deposition duration.

