
Fig. 1. P5CS protein levels vary but proline levels are elevated in melanomas.
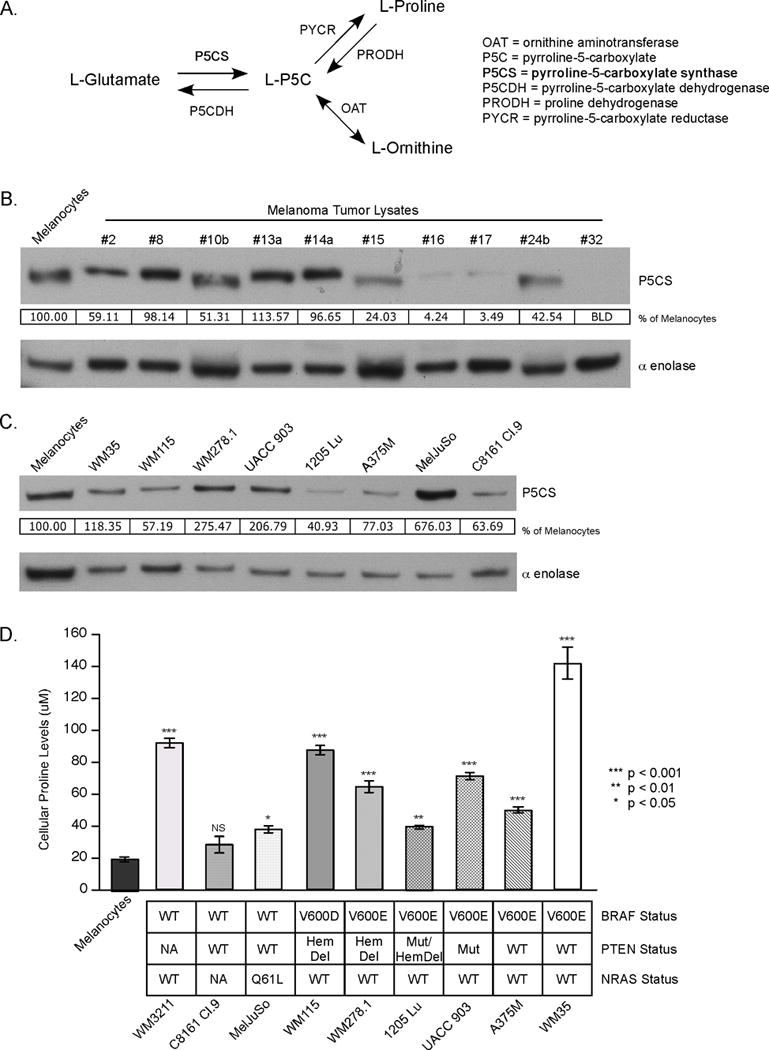
(A) Diagram of the biosynthetic pathway involving the ALDH18A1 enzyme P5CS; P5CS, Δ1-pyrroline-5-carboxylate synthase; P5C, pyrroline-5-carboxylate; P5CDH, pyrroline-5-carboxylate dehydrogenase; PYCR, pyrroline-5-carboxylate reductase; PRODH, proline dehydrogenase; OAT, ornithine aminotransferase. (B, C) Western blots comparing P5CS protein levels of melanocytes (FOM103) versus melanoma tumor lysates (B) and melanocytes versus melanoma cell lines (C). Protein band intensity was quantified using ImageJ software and P5CS values normalized to the alpha enolase protein loading control and expressed as a percentage of melanocyte control. (D) Intracellular proline levels measured by LC-MS/MS. Absolute cellular concentration was quantitated by comparison to a norvaline internal control (N=4). Bars; average, ±SEM. NS, not significant. Cell lines were stratified according to BRAF, PTEN, and NRAS mutational status. WT, wildtype. Hem Del, hemizygous deletion. Mut, mutation. NA, no data available.