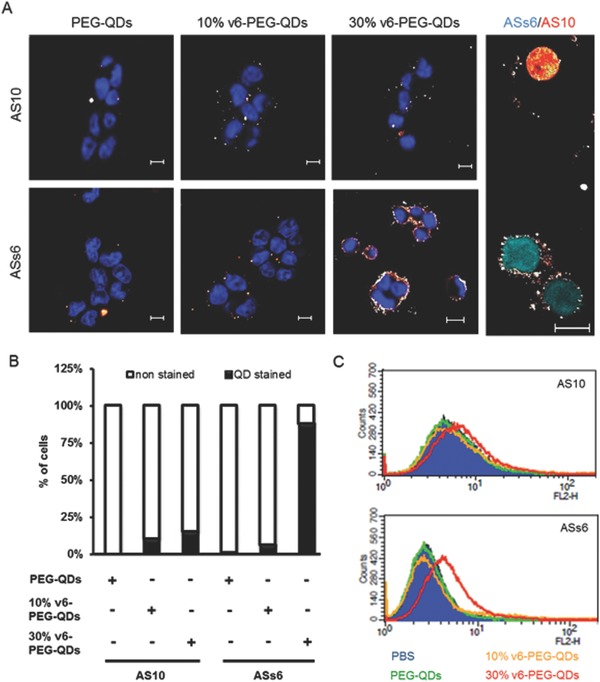
Figure 5.

v6‐PEG‐QDs bind specifically to CD44v6 expressing tumor cells A) Panels 1–3: AS10 or ASs6 cells incubated with 100 μg mL−1 PEG‐QDs (control), 10% v6‐PEG‐QDs, or 30% v6‐PEG‐QDs were costained with DAPI and visualized by fluorescence microscopy. Panel 4: AS10 cells transfected with mCherry (red) and ASs6 cells transfected with CFP (cyan) were cocultured and stained with 30% v6‐PEG‐QDs. Magnification, 40×. B) Percentages of quantum dot stained cells was quantified. C) AS10 or ASs6 cells were incubated with PBS or 100 μg mL−1 PEG‐QDs, 10% v6‐PEG‐QDs, or 30% v6‐PEG‐QDs for 10 min and analyzed by FACS measurement.
