
Figure 9.
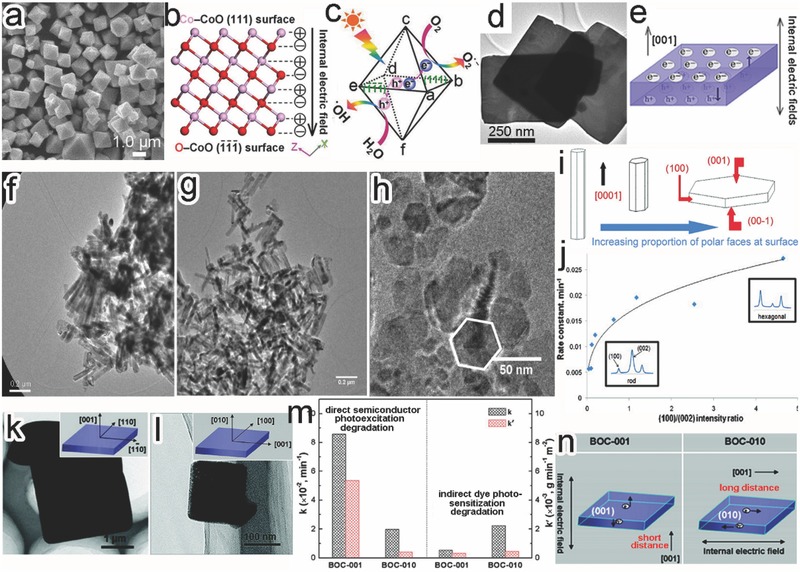
a) SEM image of CoO octahedrons. b) Atomic charge distribution of CoO {111} and facets. c) Schematic illustration for the charge separation between polar {111} surfaces. Reproduced with permission.62 Copyright 2015, American Chemical Society. d) TEM image of Bi4Ti3O12 nanosheets dominated with {001} facets. e) Schematic illustration for the charge separation along [110] direction. Reproduced with permission.63 Copyright 2014, Elsevier. f–h) TEM images of (f) long ZnO rods, (g) short ZnO rods, and (h) hexagonal ZnO plates. i) Schematic diagrams showing the increased proportion of polar facets from rods to plates. j) Plot of the rate constants vs. (100)/(002) intensity ratio in MB photodegradation. Reproduced with permission.64 Copyright 2009, American Chemical Society. k,l) TEM images and scheme (inset) of (k) BOC‐001 and (l) BOC‐010. m) Comparison of reaction rate constants between BOC‐001 and BOC‐010 in MO degradation under (left) UV and (right) visible‐light irradiation. n) Schematic for the corresponding mechanism. Reproduced with permission.18 Copyright 2012, American Chemical Society.