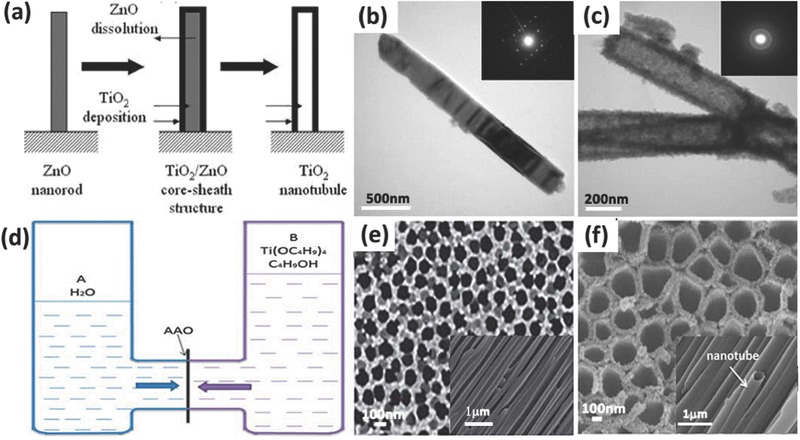
Figure 9.

Schematic of the steps for forming the end‐closed TiO2 nanotube using positive template (a). TEM images of ZnO nanorods (b), TiO2 nanotubes (c), and their associated selected area electron diffraction patterns. Schematic diagram of the experimental device composed of two half U‐tube cells separated by an AAO membrane (d), the typical surface and section SEM images of AAO (e), and SEM images of TiO2 nanotubes prepared with Ti(OC4H9)4 solution in half‐cell B (f).(a–c) Reproduced with permission.163 Copyright 2005, Royal Society of Chemistry. (d–f) Reproduced with permission.164 Copyright 2013, Royal Society of Chemistry.
