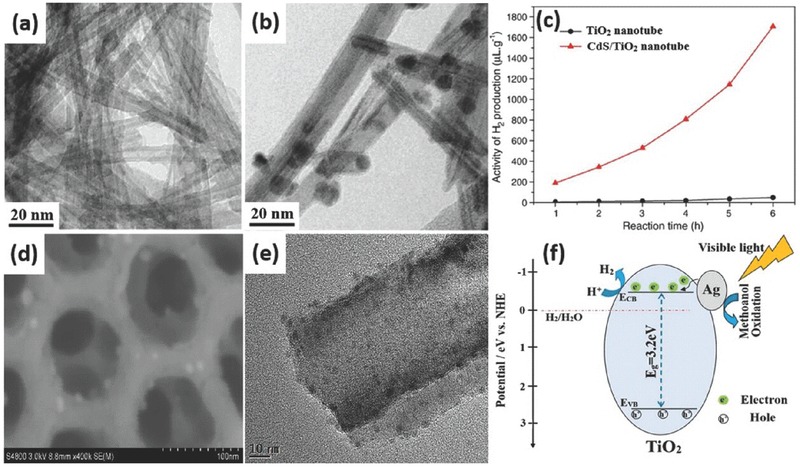
Figure 19.

TEM images of TiO2 nanotube (a) and CdS/TiO2 nanotube (b), respectively. Activities of H2 evolution for TiO2 nanotube and CdS/nanotube under visible light irradiation for 6 h (c). SEM (d) and TEM (e) image of Ag/TiO2 NTAs, respectively. Schematic diagram showing the energy band structure and electron‐hole pairs separation in Ag/TiO2 NTAs under visible light irradiation (f). (a–c) Reproduced with permission.251 Copyright 2008, Elsevier. (d–f) Reproduced with permission.256 Copyright 2016, Royal Society of Chemistry.
