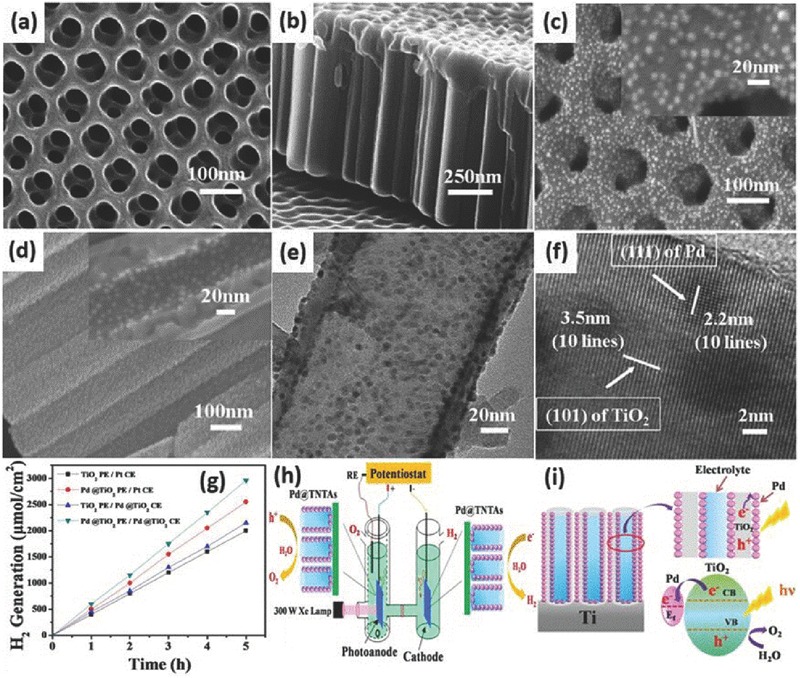
Figure 21.

Top and cross‐sectional SEM images of pure TNAs (a,b) and Pd QDs/TNAs (c,d). The insets show the corresponding magnified images. TEM (e) and HRTEM (f) images of TNAs coated with Pd QDs. Amount of hydrogen generated by capitalizing on TiO2 nanotubes and Pd/TNTAs nanocomposites as photoanodes and Pt foil and Pd/TNTA nanocomposites as cathodes at –0.3 VSCE in a PEC cell containing a 2 M Na2CO3 and 0.5 M ethylene glycol solution under 320 mW cm–2 irradiation (g). Schematic of Pd/TNAs on photoelectrolytic water splitting for hydrogen production (h). Schematic illustration of TNAs deposited with Pd QDs and the charge transfer process from TiO2 to Pd (i). Reproduced with permission.135 Copyright 2012, American Chemical Society.
