Figure 22.

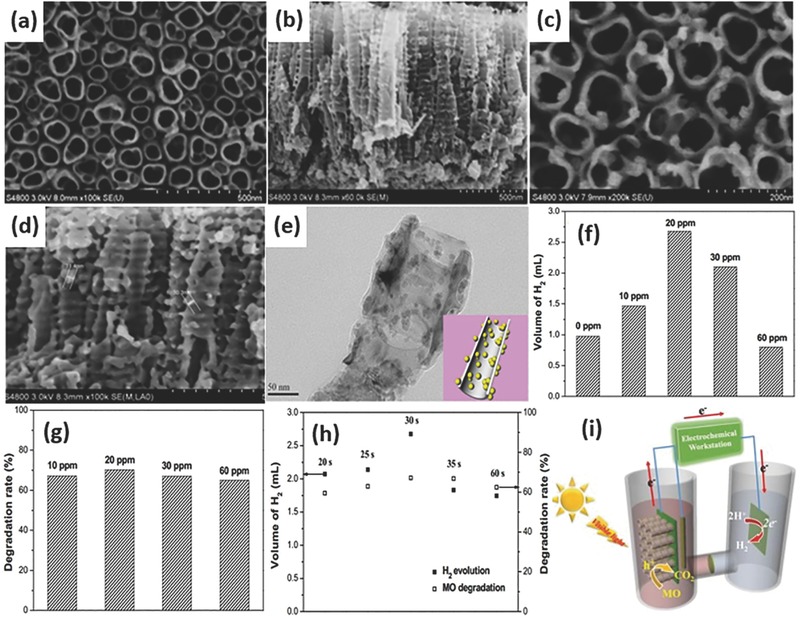
SEM images of pure TiO2 nanotube arrays (a,b) and CdSe/NTAs (c,d). TEM image of CdSe/NTAs (e). The volume of the evolved hydrogen on Pt foil (f), and the degradation rate of MO with different concentration MO (g) under the visible light illumination. (CdSe/TiO2 NTAs with electrodeposition for 30 s as photoanode, Pt foil as counter electrode, reaction time = 2 h). Photoelectrocatalytic H2 evolution and MO (20 ppm) degradation rates on different samples by changing the electrodeposition time (h). Schematic of CdSe/NTAs on photoelectrolytic water splitting for hydrogen production and degradation rate of MO at the same time (i). Reproduced with permission.276 Copyright 2016, Elsevier.
