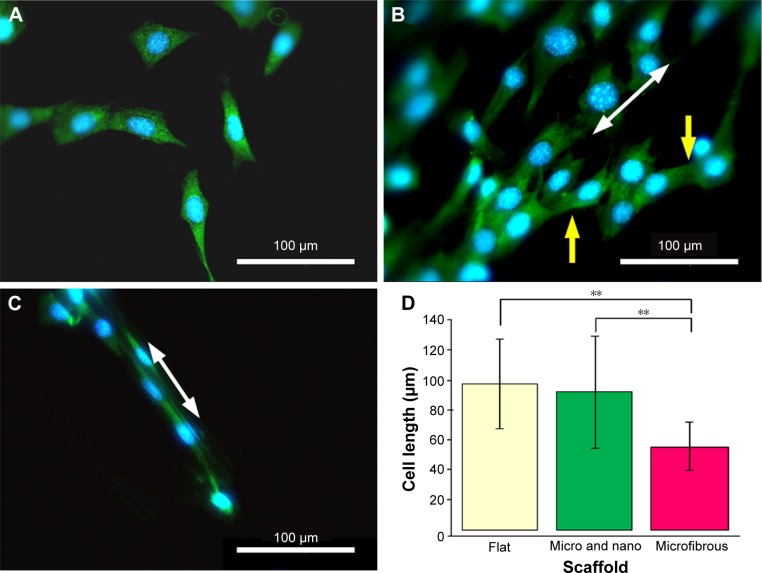
Figure 9.
Fluorescence microscopy images of cells after 3 days of culture on (A) a flat poly(lactic-co-glycolic acid), (B) a micro/nanostructured, and (C) a microfibrous membrane. (D) Cell length comparisons (n=3).
Notes: Green: neurite staining of β-tubulin; blue: nucleus stained with 4′,6-diamidino-2-phenylindole; white arrow: orientation of the micro/nanostructures; yellow arrow: cell branches and the cell crossing over from one ridge to a neighboring ridge. **P<0.001.

