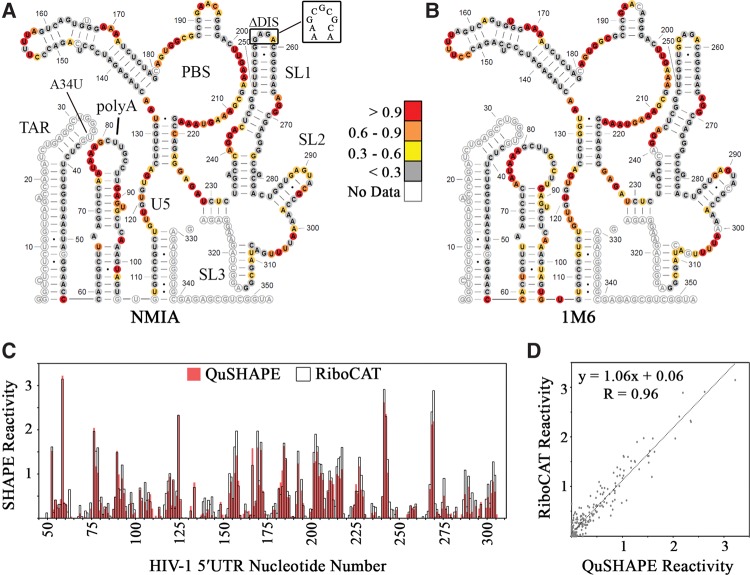
FIGURE 5.
RiboCAT replicates QuSHAPE-derived reactivities in the HIV-1 5′UTR. The lowest energy secondary structures calculated by RNAStructure using reactivity values derived using NMIA (A) and 1M6 (B). Sites of mutation, A34U and ΔDIS, are noted with the WT DIS shown. The reactivities at each nucleotide are depicted as colored circles matching the legend in the middle. (C) SHAPE reactivities calculated using QuSHAPE (red) and RiboCAT (black outline) plotted for each nucleotide show a high degree of similarity with regions of high and low reactivity matching in both plots. (D) The SHAPE reactivities calculated using RiboCAT and QuSHAPE are very comparable with a Pearson's R-value of 0.96.

