Figure 1.
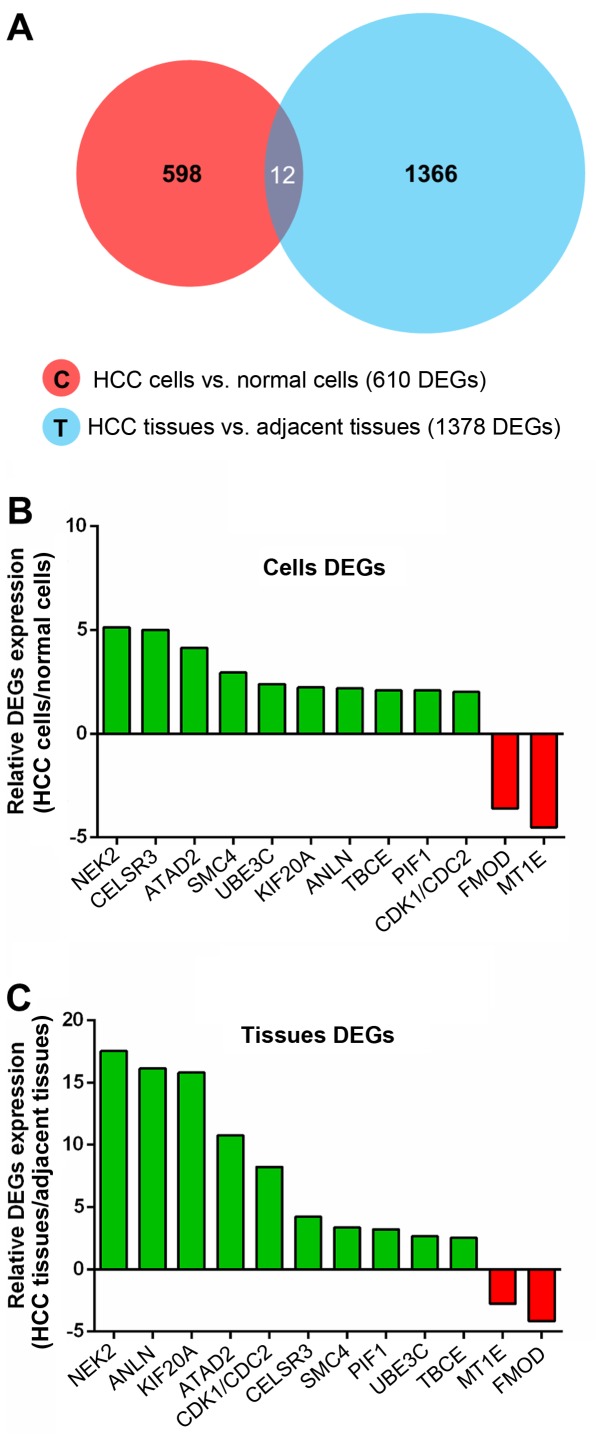
The common differential genes between cell DEGs and tissue DEGs. (A) Venn diagram of the overlaps between cell DEGs and tissue DEGs. The red circle represents 610 DEGs between HCC cells and normal liver cells. The blue circle represents 1378 DEGs between HCC tissues and adjacent non-tumorous liver tissues. There were 12 common differential genes between the two circles. (B) Relative expression of 12 common differential genes in HCC cell line SMMC-7721, when compared with normal liver cell HL-7702. (C) Relative expression of 12 common differential genes in HCC tissues, when compared with adjacent non-tumorous liver tissues.

