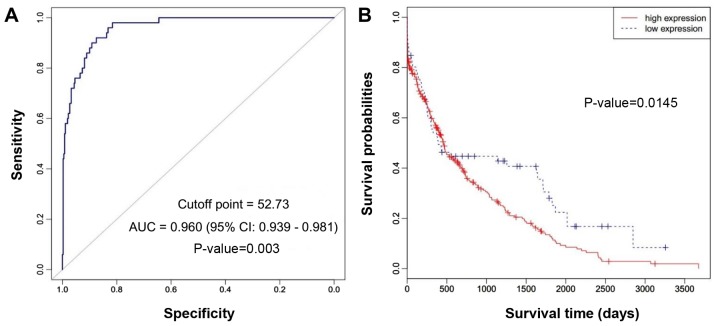
Figure 3.
ROC and Kaplan-Meier curves for NEK2 expression in TCGA HCC RNAseq dataset. (A) ROC curve analysis to determine the cut-off point for the high expression of NEK2. The area under curve (AUC) was 0.960 (95% CI, 0.939–0.981), and the cut-off point of NEK2 for high expression was 52.73. (B) Kaplan-Meier curve for HCC patients in high-expression (n=66) and low-expression (n=293) groups segregated by the cut-off point. HCC patients with a high expression of NEK2 had a poor prognosis (log-rank test, P=0.0145).

