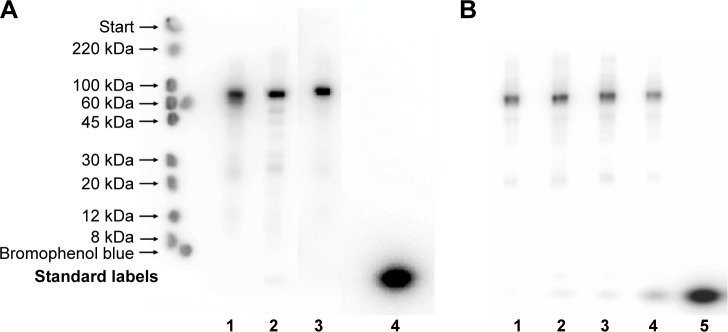
Figure 3.
(A) Autoradiography of SDS-PAGE gels of 111In-NOTA–MNT-MSH (lane 1), 111In-NOTA–MNT-FA (lane 2), 111In-NOTA–MNT-EGF (lane 3), and control 111In (lane 4). “Standard labels” indicate the bands from the ColorBurst™ Electrophoresis Markers. Prominent main band corresponds to the expected molecular weight for these constructs (70–76 kDa); negligible bands migrating directly ahead of bromophenol blue (compared to lane 4) correspond to free 111In (3%–5%). The faint bands (1%–10%), corresponding to an Mw of 20–50 kDa, are MNT-NOTA protein degradation products that were eventually labeled. (B) Autoradiography of SDS-PAGE gels of 111In-NOTA–MNT-MSH at different 111In/MNT ratios in the reaction mixture: 0.2 GBq/mg (lane 1), 1.1 GBq/mg (lane 2), 2.0 GBq/mg (lane 3), 4.4 GBq/mg (lane 4), 7.3 GBq/mg (lane 5).
Abbreviations: EGF, epidermal growth factor; FA, folic acid; MNT, modular nanotransporter; MSH, α-melanocyte-stimulation hormone; SDS, sodium dodecyl sulfate.

