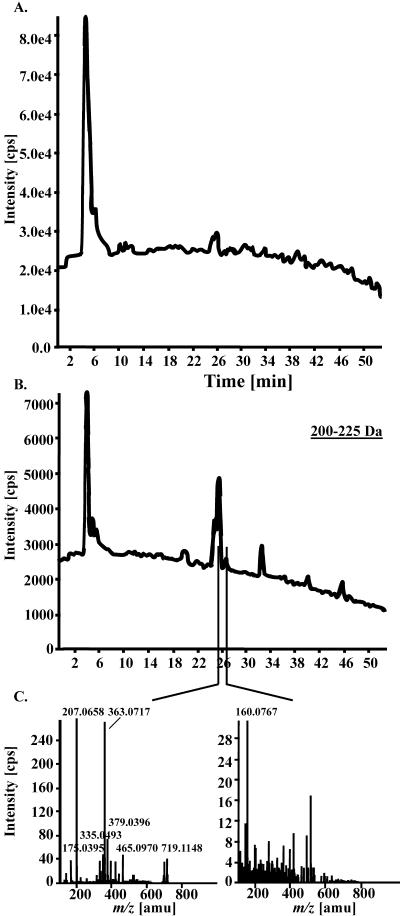
Figure 1.
Manual deconvolution of data generated by CapLC-ESI-QqTOF-MS. A 53-min LC-MS analysis generated a total ion chromatogram consisting of 1,590 single MS spectra. A, The total ion chromatogram was manually deconvoluted in 25-D slices resulting in single extracted ion chromatograms (XICs) covering, for example, a mass range from 200 to 225 D. B, Mass spectra were then extracted from peaks apparent within a particular time frame of the XIC. The extracted peak at tR 26.0 min (C, left) represents sinapoyl malate ([M+Na]+ m/z 363.0717;[2 sinapoyl malate+K]+ m/z 719.1148; in-source fragment at m/z 207.0658). The extracted XIC valley at 26.6 min (C, right) represents a typical background mass spectrum.

