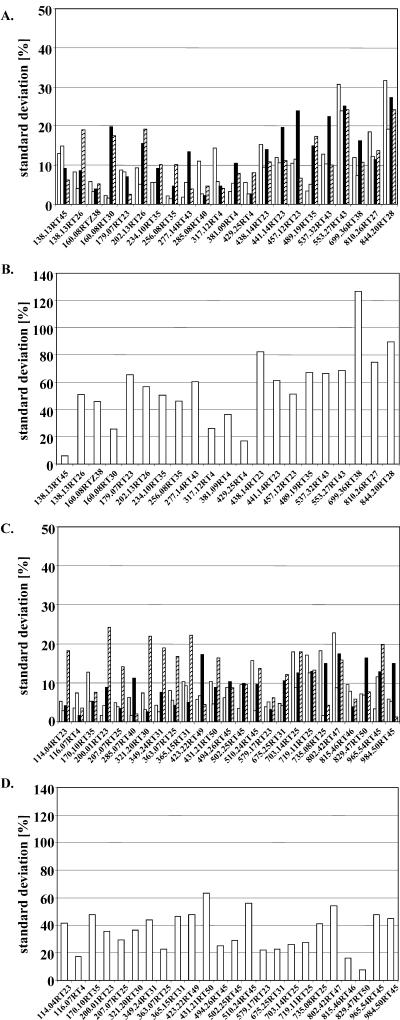
Figure 2.
Technical and biological variance of the CapLC-ESI-QqTOF-MS analysis assessed by analyzing 25 mass signals from leaf extracts and 22 mass signals from root extracts. Signals are identified by mass and tR. Technical reproducibility of the LC-MS analysis of methanolic root (A) and leaf extracts (C) was determined by extracting the same material three times as well as performing three repetitions of the LC-MS measurements. Quantification of 22 selective ion traces in root extracts and 25 ion traces in leaf extracts was carried out. The sd of the three independent LC-MS analyses of a single extract is represented in the white, gray, and black bars of the charts. The cumulative sd for repeated analysis of the same extract showed a value of 11.1%. Comparison of the three different extracts of the same material (striped bar) resulted in an average variability of 25% ± 17.9% for leaves and 21.6% ± 13.4% for roots. When four independent experiments were analyzed, an average biological variation was measured of 35.5% ± 14.0% for leaf signals (D) and 55.9% ± 26.0% for root signals (B).

