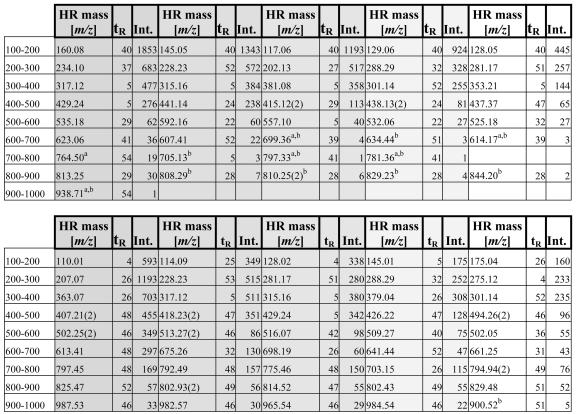
Table III.
List of the most abundant mass signals from root (top) and leaf (bottom) extracts incremented in 100-Da steps
From left to right and indicated by the shading, the five strongest signals are listed. HR mass (m/z) and tR (min) are used as identifiers. Intensities (Int.) are given as area per milligram of fresh weight. Doubly charged ions are marked with the charge state in brackets (2).

