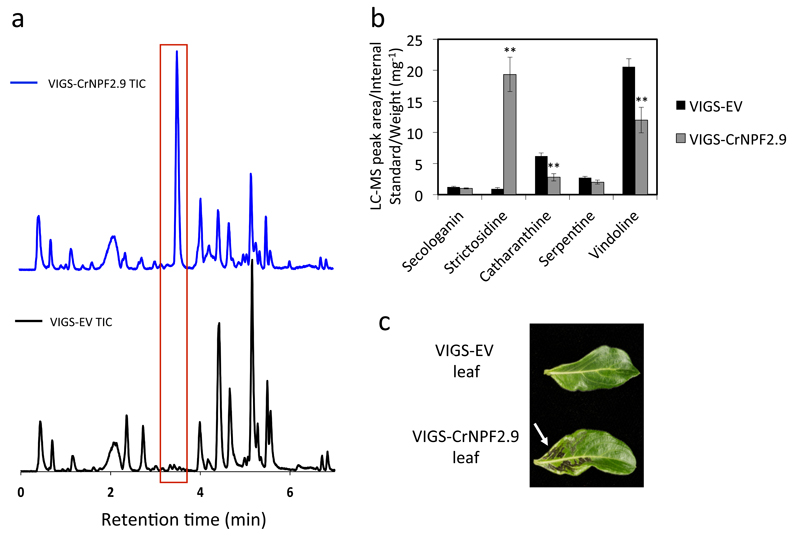
Figure 3. In planta silencing of CrNPF2.9.
A. Representative total ion chromatogram (TIC) of leaf tissue extracts from Little Bright Eyes plants transformed with empty vector (VIGS-EV, black), and a vector designed to silence CrNPF2.9 (VIGS-CrNPF2.9, blue). The red box highlights the accumulation of strictosidine. B. Alkaloid profiles for tissue transformed with the VIGS-CrNPF2.9 vector relative to the empty vector control (VIGS CrNPF2.9 (n = 12), VIGS-EV (n = 10)) ** p < 0.01. All data shown are mean ± SEM. C. Blackened leaf tissue that results upon silencing of CrNPF2.9 highlighted by a white arrow.

