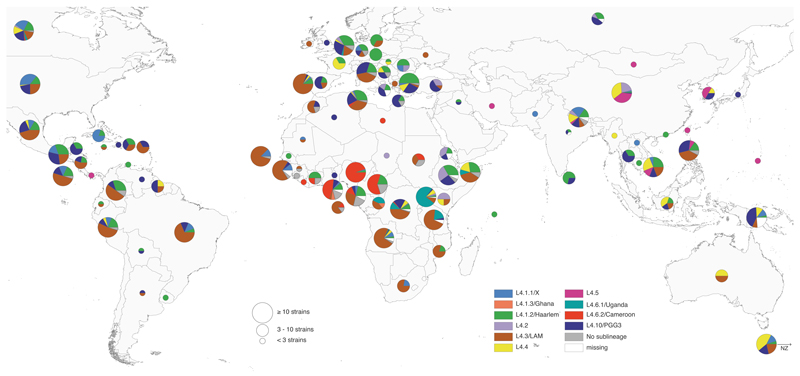
Figure 2. Global distribution of Lineage 4 sublineages.
Pie charts showing proportions of the 10 Lineage 4 sublineages among all MTBC Lineage 4 isolates in each country. Circle sizes correspond to the number of isolates analyzed per country. A total of 3,366 MTBC Lineage 4 isolates were included. Color codes are as in Fig. 1.

