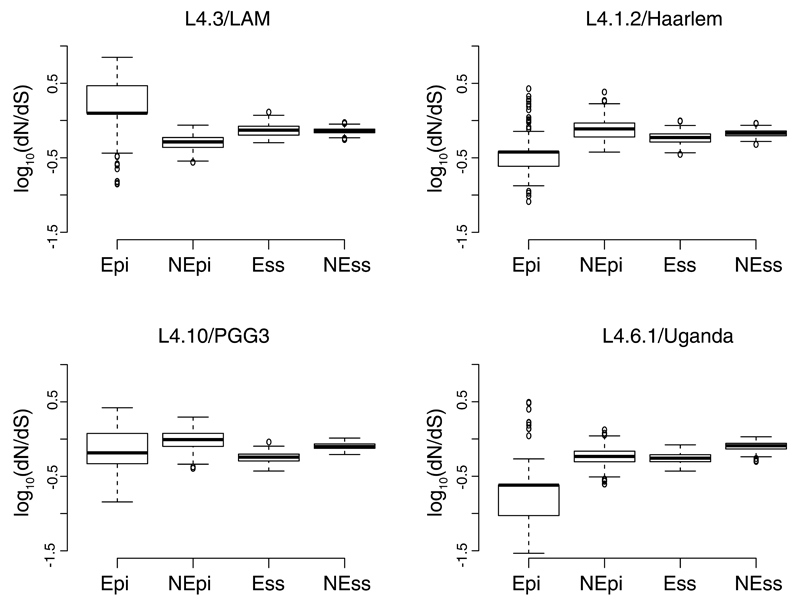
Figure 4. Pair-wise ratios of rates of nonsynonymous to synonymous substitutions (dN/dS) in generalist and specialist sublineages for different gene categories.
Abbreviations: Epi – experimentally confirmed human T cell epitopes; nEpi – non-epitope regions of T-cell antigens, both obtained from the Immune Epitope Database60; Ess – essential genes62; nEss – non-essential genes62. Wilcoxon rank sum tests: L4.6.1/Uganda (N=203) Epi vs nEpi, W=4952, p<0.001; L4.6.1/Uganda (N=203) Ess vs nEss, W=1415, p<0.001; L4.3/LAM (N=293) Epi vs nEpi, W=74540, p<0.001, L4.3/LAM (n=293) Ess vs nEss W=45067, p-value=0.29; L4.1.2/Haarlem (N=228) Epi vs nEpi, W=6561, p<0.001, L4.1.2/Haarlem (N=228) Ess vs nEss W=13369, p<0.001; L4.10/PGG3 (N=301) Epi vs nEpi, W= 27335, p<0.001, L4.10/PGG3 (N=301) Ess vs nEss W= 3103, p<0.001.

